Business Intelligence for e-commerce and logistics

Turn your operational data into decisions you can defend.

K.I.E Advisory is a Business Intelligence consultancy for DTC e-commerce brands and logistics operators. We build Power BI dashboards, run profit audits, and work as embedded analysts. Every engagement is priced up front and delivered as a .pbix file you keep.

  • E-commerce Business Intelligence · SKU, channel, contribution, ROAS
  • Logistics analytics · carrier, region, return-rate, delivery performance
  • Profit Audit as the entry engagement · €1,500 fixed fee

You already have the data. You do not have the answer.

You can pull a Shopify export, a carrier invoice, an ad spend report, and a stock movement file. What you cannot do is sit them on top of each other and ask which channel is profitable after returns, which carrier is silently dragging your return rate up, or which SKU is propping up the entire portfolio. That is the question we answer.

Services

Who we work with

Two kinds of business: consumer brands selling direct online, and operators moving physical goods across Europe. Most clients start with a Profit Audit and grow the engagement from there. Some come in for a specific dashboard build and never need an audit.

Vertical 01

E-commerce & DTC

Shopify-tier brands and multi-channel sellers doing €500K to €10M annually. Usually the headline P&L looks healthy, but nobody can tell you which SKUs are actually paying the bills.

  • SKU-level profitability and contribution margin analysis
  • ROAS attribution across channels and campaigns
  • Return-rate and refund erosion by product and cohort
  • Break-even and price-elasticity modelling
  • Scenario simulators for ad reallocation and pricing changes
See the Beauty DTC case study

Vertical 02

Logistics & Fulfilment

Multi-carrier 3PLs, cross-border e-commerce operators, and in-house fulfilment teams running fragmented reporting across systems.

  • Carrier benchmarking on return rate, damage, and delivery days
  • Country and region-level performance decomposition
  • Cost-to-serve modelling per SKU, per lane, per carrier
  • Fulfilment KPI dashboards for weekly ops reviews
  • Carrier reallocation and network optimisation plans

See the Logistics case study

Not sure which fits? Request a Margin-Leak Assessment and describe your data. We will tell you what an audit would surface.

Selected work

Case studies

Two reference architectures, one per vertical. The financial modelling matches live mid-market DTC and multi-carrier logistics configurations. Client numbers stay with the client, so we built these to show you what a real audit deliverable looks like page by page.

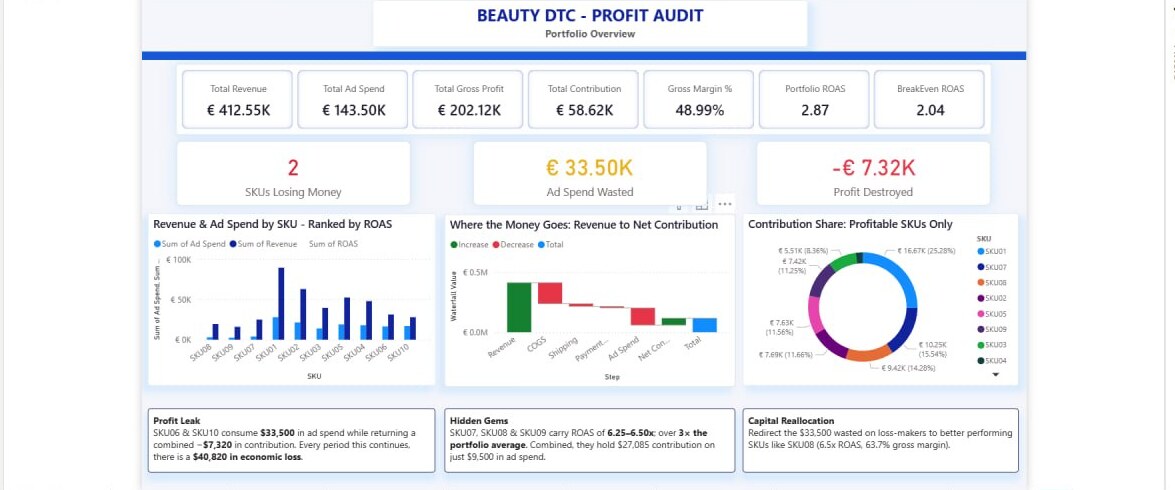
Beauty DTC profit audit dashboard, portfolio overview page

DTC e-commerce

Beauty DTC Profit Audit

Eight-page audit on a reference architecture beauty brand modelled at €412.55K annual revenue across 10 SKUs. Surfaced €40,820 in misallocated capital, flagged two structurally loss-making SKUs, and built a live scenario simulator modelling a +44% contribution uplift without launching a new product.

  • Disconnected dimension tables for shared-measure routing
  • VAR-driven contribution margin to avoid circular dependency
  • Three live what-if parameters driving simulated contribution
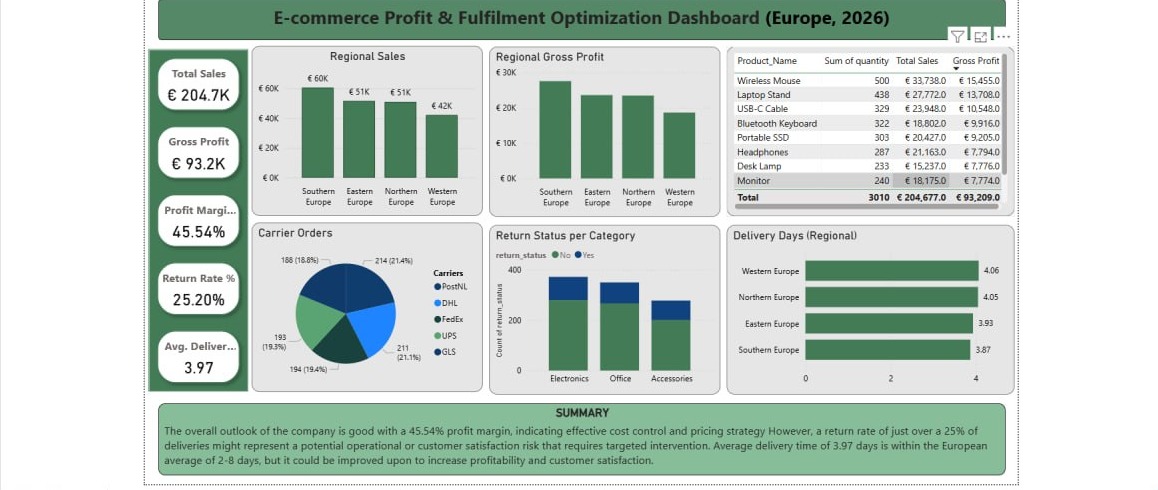
Logistics and fulfilment optimisation dashboard, executive summary page

Logistics and 3PL

Logistics and Fulfilment Optimisation

Six-page audit on a reference architecture pan-European fulfilment network modelled at €204.7K in sales across 1,000 orders, 20 countries, and 5 carriers. Surfaced GLS at 31.91% return rate versus PostNL at 21.96% despite comparable delivery speed, and produced a country-level carrier reallocation plan.

  • Multi-carrier benchmarking across region and SKU
  • Return-rate anomaly detection separated from speed metrics
  • Five operating KPIs surfaced on a single executive page

How it works

Four steps from raw CSVs to a Power BI model you can rerun.

  1. 01

    Margin-Leak Assessment

    A short working call. Bring one report you actually use to make decisions. We tell you what is missing from it and what an audit would surface. It is how we figure out together whether there is a fit.

  2. 02

    You send the data

    Order data, product cost data, carrier or shipping data, and any spend data you track. CSV or Excel is enough. If it lives in Shopify, Xero, or a WMS export, it is fine. I clean it.

  3. 03

    I build the audit

    Five to ten working days. You get a six-page Power BI report with a scenario simulator, drill-through architecture, and a written diagnosis page. The case studies above show the exact depth of the deliverable.

  4. 04

    You keep the file

    Delivered as a .pbix file. You can open it in the free Power BI Desktop on Windows. You only need a paid licence if you want to share it online with your team.

Pricing

Pricing

Prices are listed publicly and quoted up front. The Profit Audit is the offer most clients start with when they want a diagnostic. Retainers and custom builds are scoped separately when the work calls for it.

Where most engagements begin

Profit Audit

1,500

One-time, fixed fee

  • Six-page Power BI report on your data
  • SKU and segment-level profitability framework
  • Scenario simulator with live what-if parameters
  • Drill-through architecture down to row level
  • Four written recommendations tied to specific measures
  • Delivered as a .pbix file you keep, no licence needed to read
Request a Margin-Leak Assessment

Insight Retainer

400/mo

Tier 1, after audit

  • Monthly data refresh
  • Scenario re-run on updated numbers
  • One dashboard adjustment per month
  • Written PDF brief on what changed
Ask about this tier

Embedded Analyst

900/mo

Tier 2, after audit

  • Weekly data refresh
  • Thirty-minute monthly review call
  • Unlimited dashboard adjustments
  • Faster turnaround on ad-hoc questions
Ask about this tier

Custom dashboard builds, embedded analytics, or larger e-commerce and logistics data projects are scoped separately, always as fixed-fee engagements. Ask for a quote.

About

Operator background. Advanced Power BI.

Kenechukwu (Donald) Ifeanyi-Ezeaka
Kenechukwu (Donald) Ifeanyi-Ezeaka, founder. Bratislava.

I am Kenechukwu (Donald) Ifeanyi-Ezeaka. K.I.E Advisory is the consultancy I run from Bratislava. Before I built dashboards, I worked inside European supply chain and logistics operations, at PostNL, DB Schenker, and Denso. That is where the method comes from. I have seen the gap between the report a founder is looking at and what is actually happening on the ground, and every model I ship is built to close it.

The Power BI architecture goes deeper than most agency output because it is engineered from the ground up to prevent data silos and circular dependencies. The .pbix files use disconnected dimension tables for shared-measure routing, layered measure architecture from unit-level to portfolio-level via SUMX, VAR-driven contribution margin, live what-if parameters for scenario simulation, drill-through pages, and tooltip canvas pages registered as tooltips. If those words mean something to you, you know the level. If they do not, the case studies show what comes out the other side.

FAQ

The questions every prospect asks

Do I need a Power BI licence to use the audit?

No. The audit is delivered as a .pbix file. You can open it in the free Power BI Desktop application on any Windows machine. A paid licence is only required if you want to publish the dashboard online for team access.

How long does an audit take?

Five to ten working days from the moment your data lands in my inbox. Most of that time is data cleaning and modelling, not analysis.

What data do you need?

CSV or Excel exports from your existing systems. Typical inputs are order data, product cost data, carrier or shipping data, and any spend data you already track. Messy is fine. Cleaning is part of the work.

Can you do it for less than €1,500?

Not at the same scope. I do offer an audit-lite at €750 with one KPI page, two or three findings, and no scenario simulator. Different product, different depth. Most clients find the full audit pays for itself on the first finding.

Who is this for?

DTC e-commerce brands doing roughly €500K to €10M in annual revenue who suspect their margin is leaking but cannot see where. Logistics operators and 3PLs running multiple carriers with patchy visibility into where the cost is going. Founders and operators who make decisions on Excel exports and want one source of truth.

Are the case study numbers from real clients?

They are reference architectures. The financial modelling matches live mid-market DTC and multi-carrier logistics configurations. The DAX architecture, the modelling depth, and the audit structure are identical to paid client work. Client-specific numbers stay confidential with the client.

Request a Margin-Leak Assessment.

A short working call. Bring one report you actually use to make decisions. We will tell you what is missing from it and what an audit would surface. If there is a fit, we scope the work. If not, you walk away with something useful anyway.

Prefer LinkedIn? DM me there.